DALLAS – In today's competitive aviation industry, punctuality reigns supreme. Whether jetting off for business or leisure, travelers prioritize airlines and airports that consistently deliver on-time performance, ensuring a smooth and stress-free travel experience. Airlines and airports that consistently demonstrate operational excellence stand out from the crowd, attracting passengers who value their punctuality and efficiency.
Based on data compiled by Cirium, a leading aviation analytics company, this article delves into the airlines and airports that excelled in on-time performance during March 2024. We'll navigate through regional rankings for airlines, highlighting the most punctual carrier in a respective region, alongside their OTP, and total flights operated.
Additionally, we'll explore the most punctual airports categorized by size, revealing the champions of punctuality across various traffic volumes.
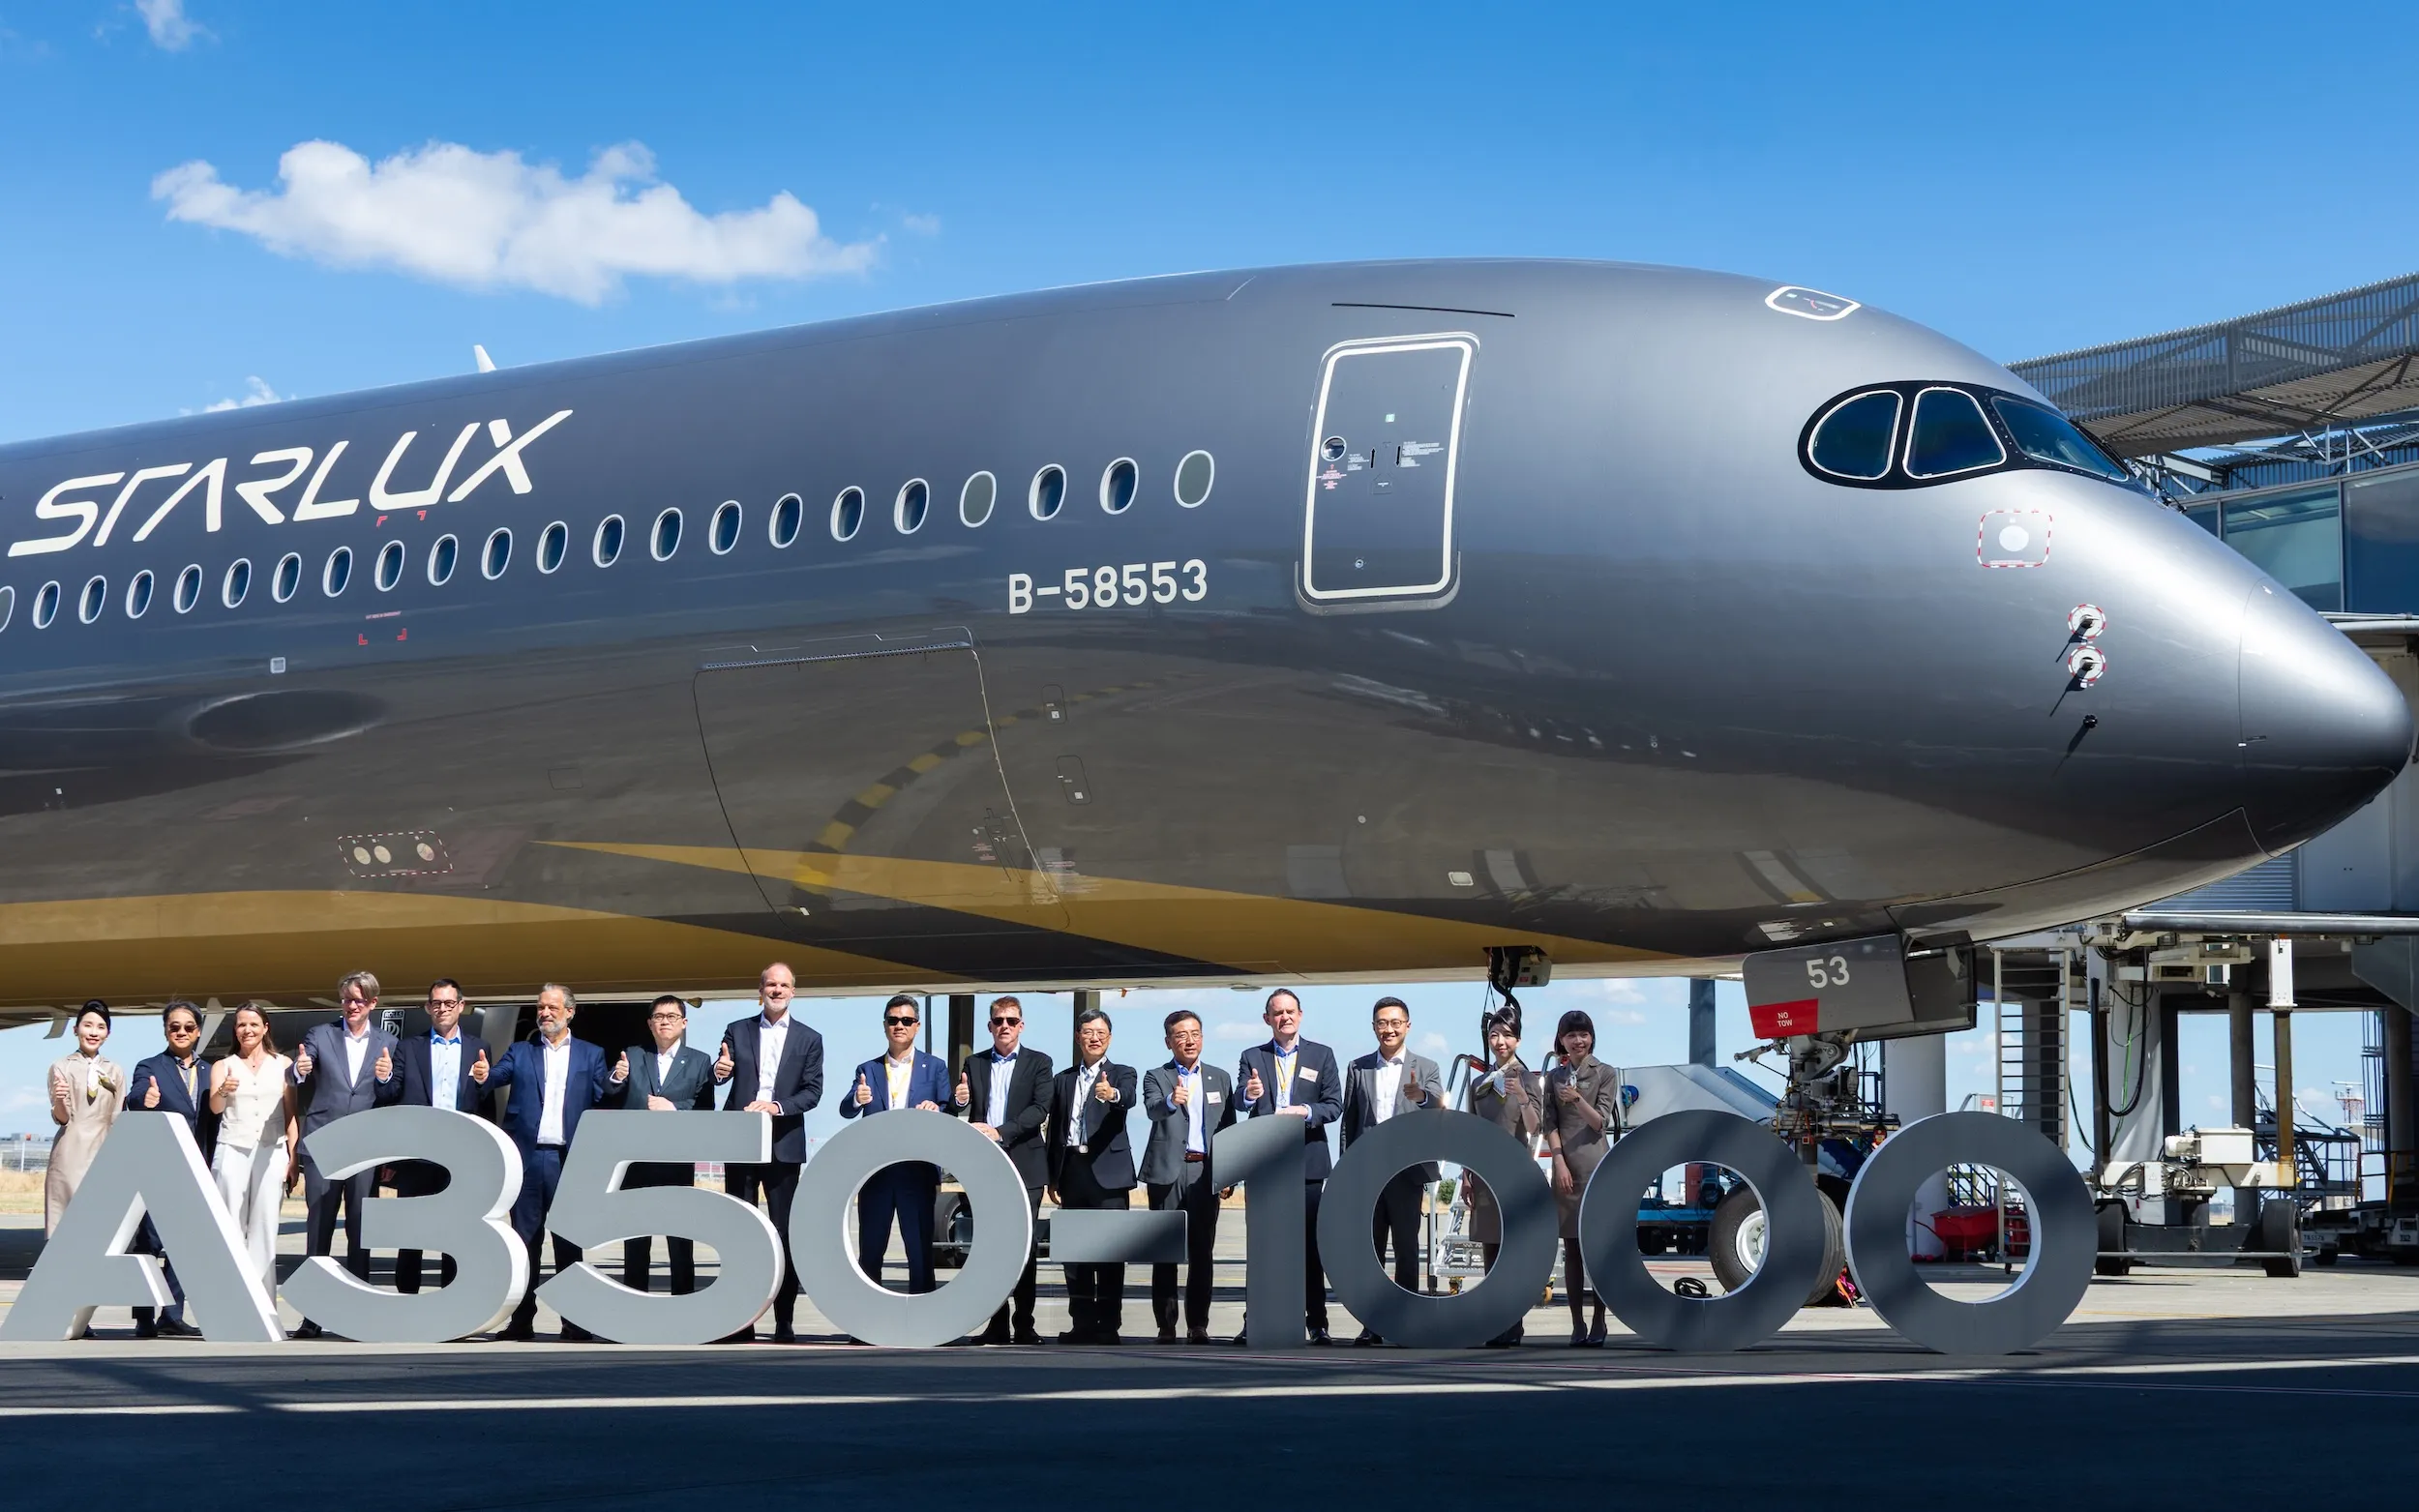
Qatar Airways became the global launch customer of the A350-1000, receiving its first example in February 2018. Photo: Qatar Airways
Most Punctual Airlines in March 2024
For a flight to be on time, a flight should arrive at the gate within 15 minutes of its scheduled time, as considered by Cirium. This industry standard provides a benchmark for evaluating an airline's operational efficiency and commitment to punctuality.
Pegasus Airlines Airbus A320neo, with registration TC-NBA. Photo: Julian Schopfer/Airways
Global Airlines
Qatar Airways (QR) has clinched the title of the most punctual global airline for March 2024, boasting an impressive On-Time Performance (OTP) of 87.36%. This marks a notable 4-point improvement compared to its performance in February.
Pegasus Airlines (PC) emerged as a new contender in the top ranks, securing the second position with an OTP of 87.14%. PC’s commendable 10-point improvement over the previous month's OTP of 76.80% underscores its continuous commitment and importance to punctuality.
N438AM Aeromexico Boeing 787-9 Dreamliner 789 JFK. Photo: Francesco Cecchetti/Airways
Notably, this improvement is mirrored by Sabiha Gokcen International Airport’s (SAW) performance. The airport serving as a hub for PC demonstrated significant improvement, achieving an OTP of 84.81%, a notable increase of nearly 9 points compared to the previous month.
Latin America shined with Avianca (AV) climbing to third place globally with an OTP of 87.05%. Aeromexico (AM) held onto fourth place despite a slight dip in performance, maintaining an OTP of 87.02%, whereas LATAM Airlines (LA) rounded out the top five with an OTP of 85.99%. Benito Juarez International Airport (MEX), serving as a primary hub for AM, reflected this trend, ranking fourth globally with an OTP of 85.93%.
Singapore Airlines 9V-SHA Airbus A350-900. Photo: Noah Pitkin/Airways
Asia-Pacific
Singapore Airlines (SQ) continued to dominate the Asia-Pacific region, securing the top position with an OTP of 88.31%, showcasing a 4-point improvement over February. AirAsia (AK) followed closely behind SQ with an OTP of 85.33%, while Philippine Airlines (PR) ranked third with an OTP of 85.28%.
Major airports in the region including Singapore Changi International Airport (SIN), Tokyo Haneda Airport (HND), and Seoul Incheon International Airport (ICN) all displayed remarkable OTP growth compared to the previous month.
Among these airports, SIN stood out with significant improvement in OTP, achieving a score of 81.59%, an increase of 6 points compared to the previous month.
N502DN Delta Air Lines Airbus A350-900. Photo: Mateo Skinner/Airways
North America
Delta Air Lines (DL) maintained its position as the most punctual airline in North America for the third consecutive month, albeit with a slight decrease in OTP to 85.54%. United Airlines (UA) followed behind with an OTP of 82.82%.
However, the region as a whole experienced a decline in on-time performance, with significant declines observed in OTP for major airlines such as American Airlines (AA), and Alaska Airlines (AS). As a whole, North American airlines and airports experienced a significant performance dip in March, with a concerning 33% rise in flight cancellations.
Major airports in the region, including Dallas/Fort Worth International Airport (DFW) and Miami International Airport (MIA), also saw substantial decreases in OTP, reflecting the operational challenges faced by the region in maintaining punctuality.
Austrian Airlines OE-LAZ Boeing 767-300(ER). Photo: Sean Brink/Airways
Europe
In March 2024, Europe experienced a notable improvement in flight operations, marked by a 14% decrease in canceled flights compared to the previous month. Austrian Airlines (OS) maintained its lead in the region with an impressive On-Time Performance (OTP) of 90.37%, despite experiencing a slight decrease of 2.59% compared to February.
LOT Polish Airlines (LO) followed OS with an OTP of 89.15%, reflecting a nearly 3-point increase over the previous month. Aegean Airlines (A3) landed the third position with an OTP of 88.42%, a slight decline compared to the prior month.
LN-DYF Norwegian Air Shuttle Boeing 737-800. Photo: Fabrizio Spicuglia/Airways
Norwegian Air Shuttle (DY) exhibited a remarkable improvement, climbing to fourth place with an OTP of 88.34%, representing a 13-point increase over February. Moreover, SunExpress (XQ) also made its mark in the top rankings, securing fifth place with an OTP of 87.90%, experiencing a 4-point increase from the previous month.
Vienna International Airport (VIE), serving as the main hub for the Austrian flag carrier concluded the month with an OTP of 85.17%, a slight decline compared to February. Eleftherios Venizelos International Airport (ATH), a hub for A3 similarly saw a decrease in OTP to 85.46%. However, Oslo Airport Gardermoen (OSL), the main hub for DY, showcased a significant improvement, achieving an OTP of 85.85%.
HP-1825CMP Copa Airlines Boeing 737-800. Photo: Luca Flores/Airways
Latin America
Latin America continued to show improvements in its flight operations in March 2024, characterized by a 6% decrease in the number of canceled flights compared to the previous month. In terms of on-time performance, Copa Airlines (CM) maintained its dominance in the region with an outstanding OTP of 90.26%, demonstrating consistent performance for three consecutive months.
Gol (G3) secured the second-place position with an OTP of 88.62%, experiencing a 6-point improvement over February's performance. Caribbean Airlines (BW) closely followed in third place with an OTP of 88.50%. Avianca (AV) and Aeromexico (AM) rounded out the top five with OTPs of 87.05% and 87.02%, respectively.
Major airports in the region, including Tocumen International Airport (PTY), Jorge Chavez International Airport (LIM), and Benito Juarez International Airport (MEX), showed significant improvements in OTP compared to the previous month.
FlySafair ZS-SJG Boeing 737-800MRU FIMP. Photo: Alberto Cucini/Airways
Middle East and Africa
Middle East & Africa experienced a surge in canceled flights in March 2024, with a 12% increase compared to the previous month. This can be largely attributed to the major disruptions and cancellations of flights in the Middle East amid heavy rain and flooding. Dubai International Airport (DXB) was severely affected by the flood, with Emirates (EK) alone canceling around 500 flights in a few days.
Safair (FA) maintained its position as the leader in the region, achieving an outstanding OTP of 96.67%, the highest performance score among all carriers across all regions. Oman Air (WY) followed in second place with an impressive OTP of 93.32%, reflecting a 5-point increase compared to the previous month.
JY-BAH Royal Jordanian Boeing 787-8 Dreamliner. Photo: Alberto Cucini/Airways
With a commendable 13-point increase over February's performance, Royal Jordanian (RJ) climbed to third place with an OTP of 89.68%. Moreover, Gulf Air (GF) and Qatar Airways (QR) rounded out the top five with OTPs of 88.35% and 87.36%, respectively.
Airports in the region as a whole demonstrated significant improvements in OTP, reflecting the overall enhancement in operational efficiency, despite the disruptions at DXB and some other airports in the region.
PR-GGN Gol Boeing 737-800. Photo: João Pedro Santoro/Airways
Low-cost Carriers
In the low-cost carrier category, Safair (FA) maintained its dominance with a record OTP of 96.67%, underscoring its consistent performance over the months. Gol (G3) secured the second-place position with an OTP of 88.62%, followed by Norwegian Air Shuttle (DY) with 88.34%.
Air Baltic (BT) and Pegasus Airlines (PC) rounded out the top five with OTPs of 87.77% and 87.14%, respectively. The remarkable performance of low-cost carriers highlights their growing significance in the aviation industry, offering passengers both reliable and affordable travel options.
Overall, while some regions experienced improvements in punctuality, others faced challenges leading to a decline in performance. This highlights the dynamic nature of the aviation industry and the importance of continuous efforts to enhance operational efficiency and ensure a seamless travel experience for passengers worldwide.
Jorge Chavez International Airport, Lima. Photo: Ministerio de Defensa del Perú
Most Punctual Airports in March 2024
Whether you're rushing to catch a connecting flight or simply want a smooth journey, knowing which airports consistently maintain on-time departures can make all the difference. Alongside the most punctual airlines by region, Cirium also compiles comprehensive rankings of airports based on their on-time departure performance across various categories, shedding light on the most punctual global airports.
At the top of the global leaderboard sits the Jorge Chavez International Airport (LIM) in Lima, Peru, with an on-time departure rate of 89.41%. Serving as a crucial hub in South America, this airport excels in ensuring timely departures for its passengers.
Following closely behind is the King Khalid International Airport (RUH) in Riyadh, Saudi Arabia, with an on-time departure rate of 87.32%. Rounding out the top three is Arturo Merino Benitez Airport (SCL) in Chile, showcasing consistent performance with an 86.95% on-time departure rate.
| On-Time Ranking | Airports | On-Time Departure | Total Flights |
| :-------------- | :-------------------------------------------- | :-----------------| :------------- |
| 1 | Jorge Chavez International Airport (LIM) | 89.41% | 13,979 |
| 2 | King Khalid International Airport (RUH) | 87.32% | 18,144 |
| 3 | Arturo Merino Benitez Airport (SCL) | 86.95% | 13,353 |
| 4 | Benito Juarez International Airport (MEX) | 85.93% | 25,094 |
| 5 | Oslo Airport Gardermoen (OSL) | 85.84% | 15,670 |
| 6 | Istanbul Airport (IST) | 85.63% | 35,725 |
| 7 | Eleftherios Venizelos International Airport (ATH) | 85.46% | 15,033 |
| 8 | Vienna International Airport (VIE) | 85.17% | 16,558 |
| 9 | Chennai International Airport (MAA) | 85.09% | 12,034 |
| 10 | Stockholm Arlanda Airport (ARN) | 84.98% | 13,596 |
| 11 | Copenhagen Airport (CPH) | 84.95% | 16,772 |
| 12 | Sabiha Gokcen International Airport (SAW) | 84.81% | 17,989 |
| 13 | El Dorado International Airport (BOG) | 84.70% | 28,922 |
| 14 | Minneapolis-St. Paul International Airport (MSP) | 84.64% | 25,718 |
| 15 | Salt Lake City International Airport (SLC) | 84.27% | 20,312 |
| 16 | Washington Dulles International Airport (IAD) | 84.14% | 17,295 |
| 17 | Detroit Metropolitan Wayne County Airport (DTW) | 84.09% | 23,874 |
| 18 | Abu Dhabi International Airport (AUH) | 83.79% | 11,729 |
| 19 | O'Hare International Airport (ORD) | 83.17% | 58,035 |
| 20 | Kempegowda International Airport (BLR) | 83.03% | 21,576 |
JA391A All Nippon Airways Airbus A380-800 arriving at HNL. Photo: Daniel Gorun/Airways
Large Airports
Large airports, defined as those serving between the 75th and 100th percentile by total flights served, with an actual gate departure coverage of 80% or better, also showcased remarkable punctuality in March.
Once again, the Jorge Chavez International Airport (LIM) leads the pack with an on-time departure rate of 89.41%. Other notable airports include the Daniel K. Inouye International Airport (HNL) in Honolulu, Hawaii, and the King Khalid International Airport (RUH) in Saudi Arabia making it to the top in this category.
| On-Time Ranking | Airports | On-Time Departure | Total Flights |
| :-------------- | :-------------------------------------------- | :-----------------| :------------- |
| 1 | Jorge Chavez International Airport (LIM) | 89.41% | 13,979 |
| 2 | Daniel K. Inouye International Airport (HNL) | 87.87% | 13,848 |
| 3 | King Khalid International Airport (RUH) | 87.32% | 18,144 |
| 4 | Arturo Merino Benitez Airport (SCL) | 86.95% | 13,353 |
| 5 | Benito Juarez International Airport (MEX) | 85.93% | 25,094 |
| 6 | Oslo Airport Gardermoen (OSL) | 85.84% | 15,670 |
| 7 | Istanbul Airport (IST) | 85.63% | 35,725 |
| 8 | Eleftherios Venizelos International Airport (ATH) | 85.46% | 15,033 |
| 9 | Vienna International Airport (VIE) | 85.17% | 16,558 |
| 10 | Chennai International Airport (VIE) | 85.09% | 12,034 |
| 11 | Stockholm Arlanda Airport (ARN) | 84.98% | 13,596 |
| 12 | Copenhagen Airport (CPH) | 84.95% | 16,772 |
| 13 | Sabiha Gokcen International Airport (SAW) | 84.81% | 17,989 |
| 14 | El Dorado International Airport (BOG) | 84.70% | 28,922 |
| 15 | Minneapolis-St. Paul International Airport (MSP) | 84.64% | 25,718 |
| 16 | Salt Lake City International Airport (SLC) | 84.27% | 20,312 |
| 17 | Washington Dulles International Airport (IAD) | 84.14% | 17,295 |
| 18 | Detroit Metropolitan Wayne County Airport (DTW) | 84.09% | 23,874 |
| 19 | Abu Dhabi International Airport (AUH) | 83.79% | 11,729 |
| 20 | LaGuardia Airport (LGA) | 83.52% | 29,278 |
PR-YSH Azul Airbus A320neo (Mickey Mouse Livery) at Brasilia International Airport. Photo: Thiago Machado/Airways
Medium Airports
In the medium airports category, Tocumen International Airport (PTY) in Panama City, Panama, takes the lead with an impressive on-time departure rate of 91.65%. PTY serves as a vital gateway for travelers in Central America, offering seamless connectivity to various destinations worldwide.
Moreover, Brazil’s Brasilia International Airport (BSB) and Japan’s Osaka International Airport (ITM) also performed well, with on-time departure rates of 88.95% and 88.63%, respectively.
A medium airport serves between the 50th and 75th percentile by total flights served in a month. These airports typically serve between 15,000,000 and 25,000,000 travelers annually.
Among small airports worldwide, Taipei Songshan Airport (TSA) in Taiwan claimed the top spot with an impressive on-time departure rate of 93.61%.
Following closely behind is Kona International Airport at Keahole (KOA), and Jose Joaquin de Olmedo Airport (GYE), with an on-time departure rate of 91.71% and 91.67% respectively.
A small airport serves between the 25th and 50th percentile by total flights served in a month, with an actual gate departure coverage of 80% or better.


.webp)


.avif)