New Cirium tracking, as of 00:00 DXB on March 7, 2026, shows outbound “cancelled or no-fly” rates falling to ~24% (partial-day).
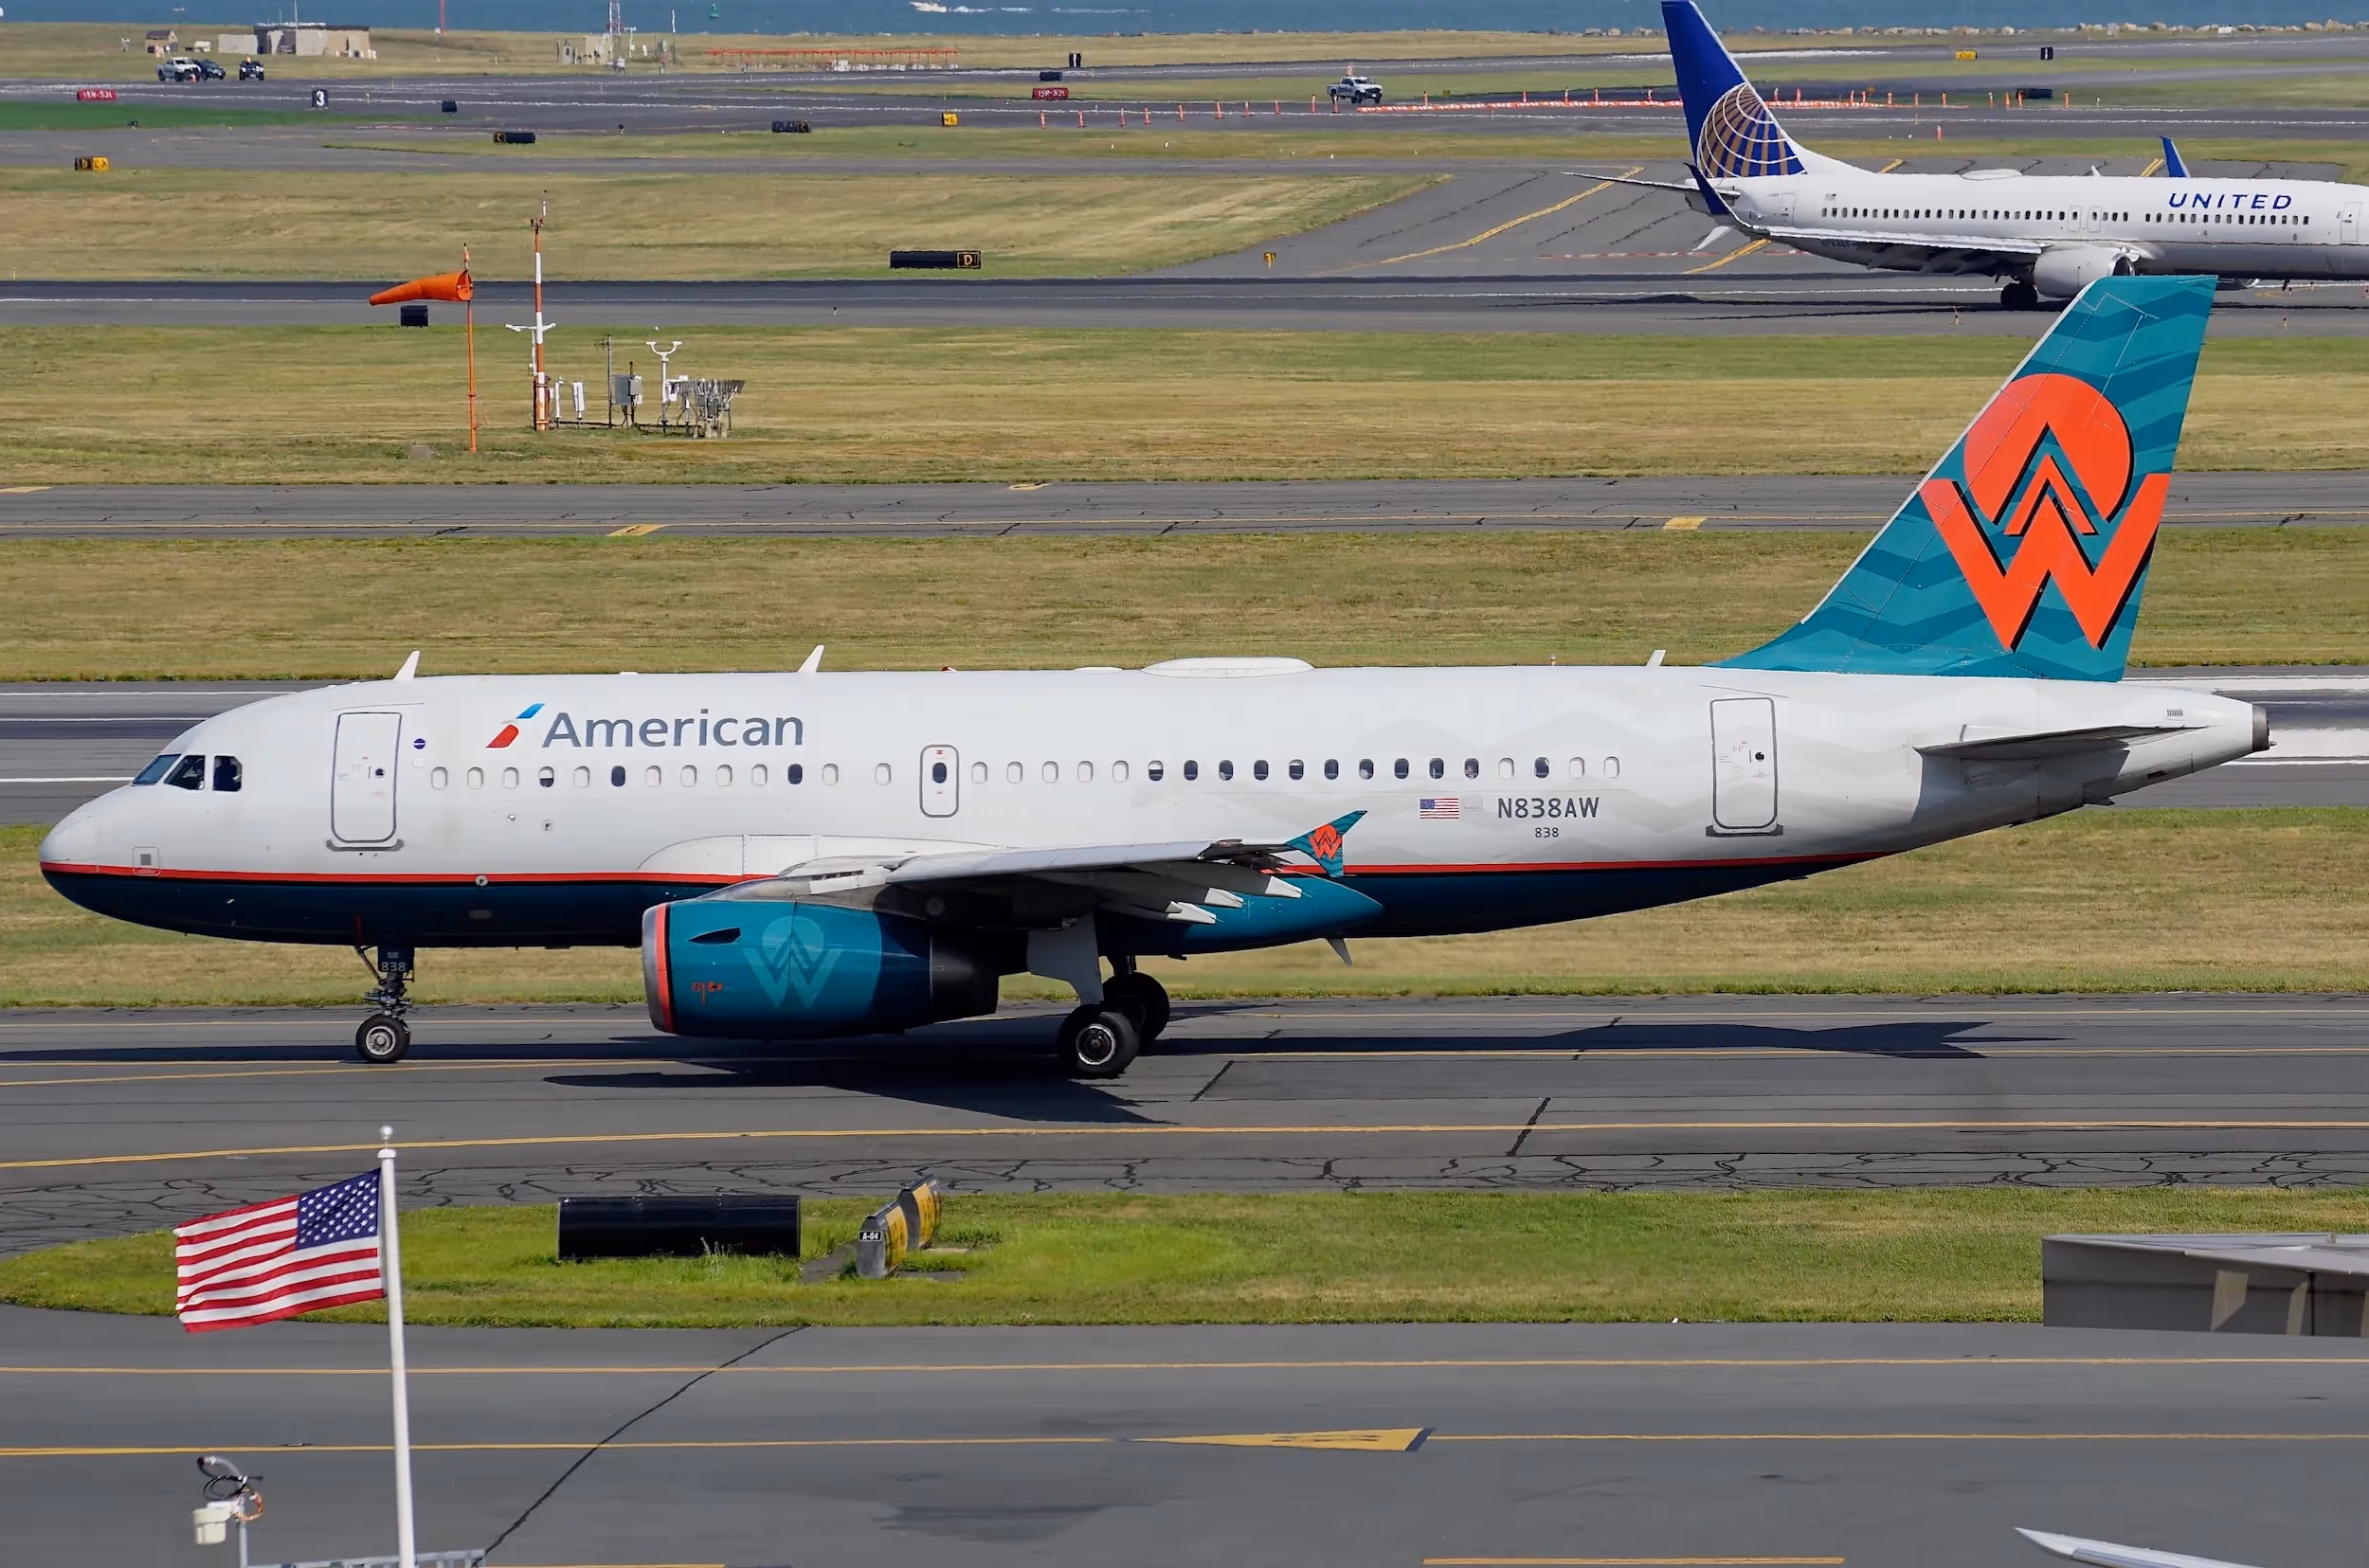
United Airlines enters 2026 with higher profit and flexibility than American Airlines, despite similar scale in 2025.
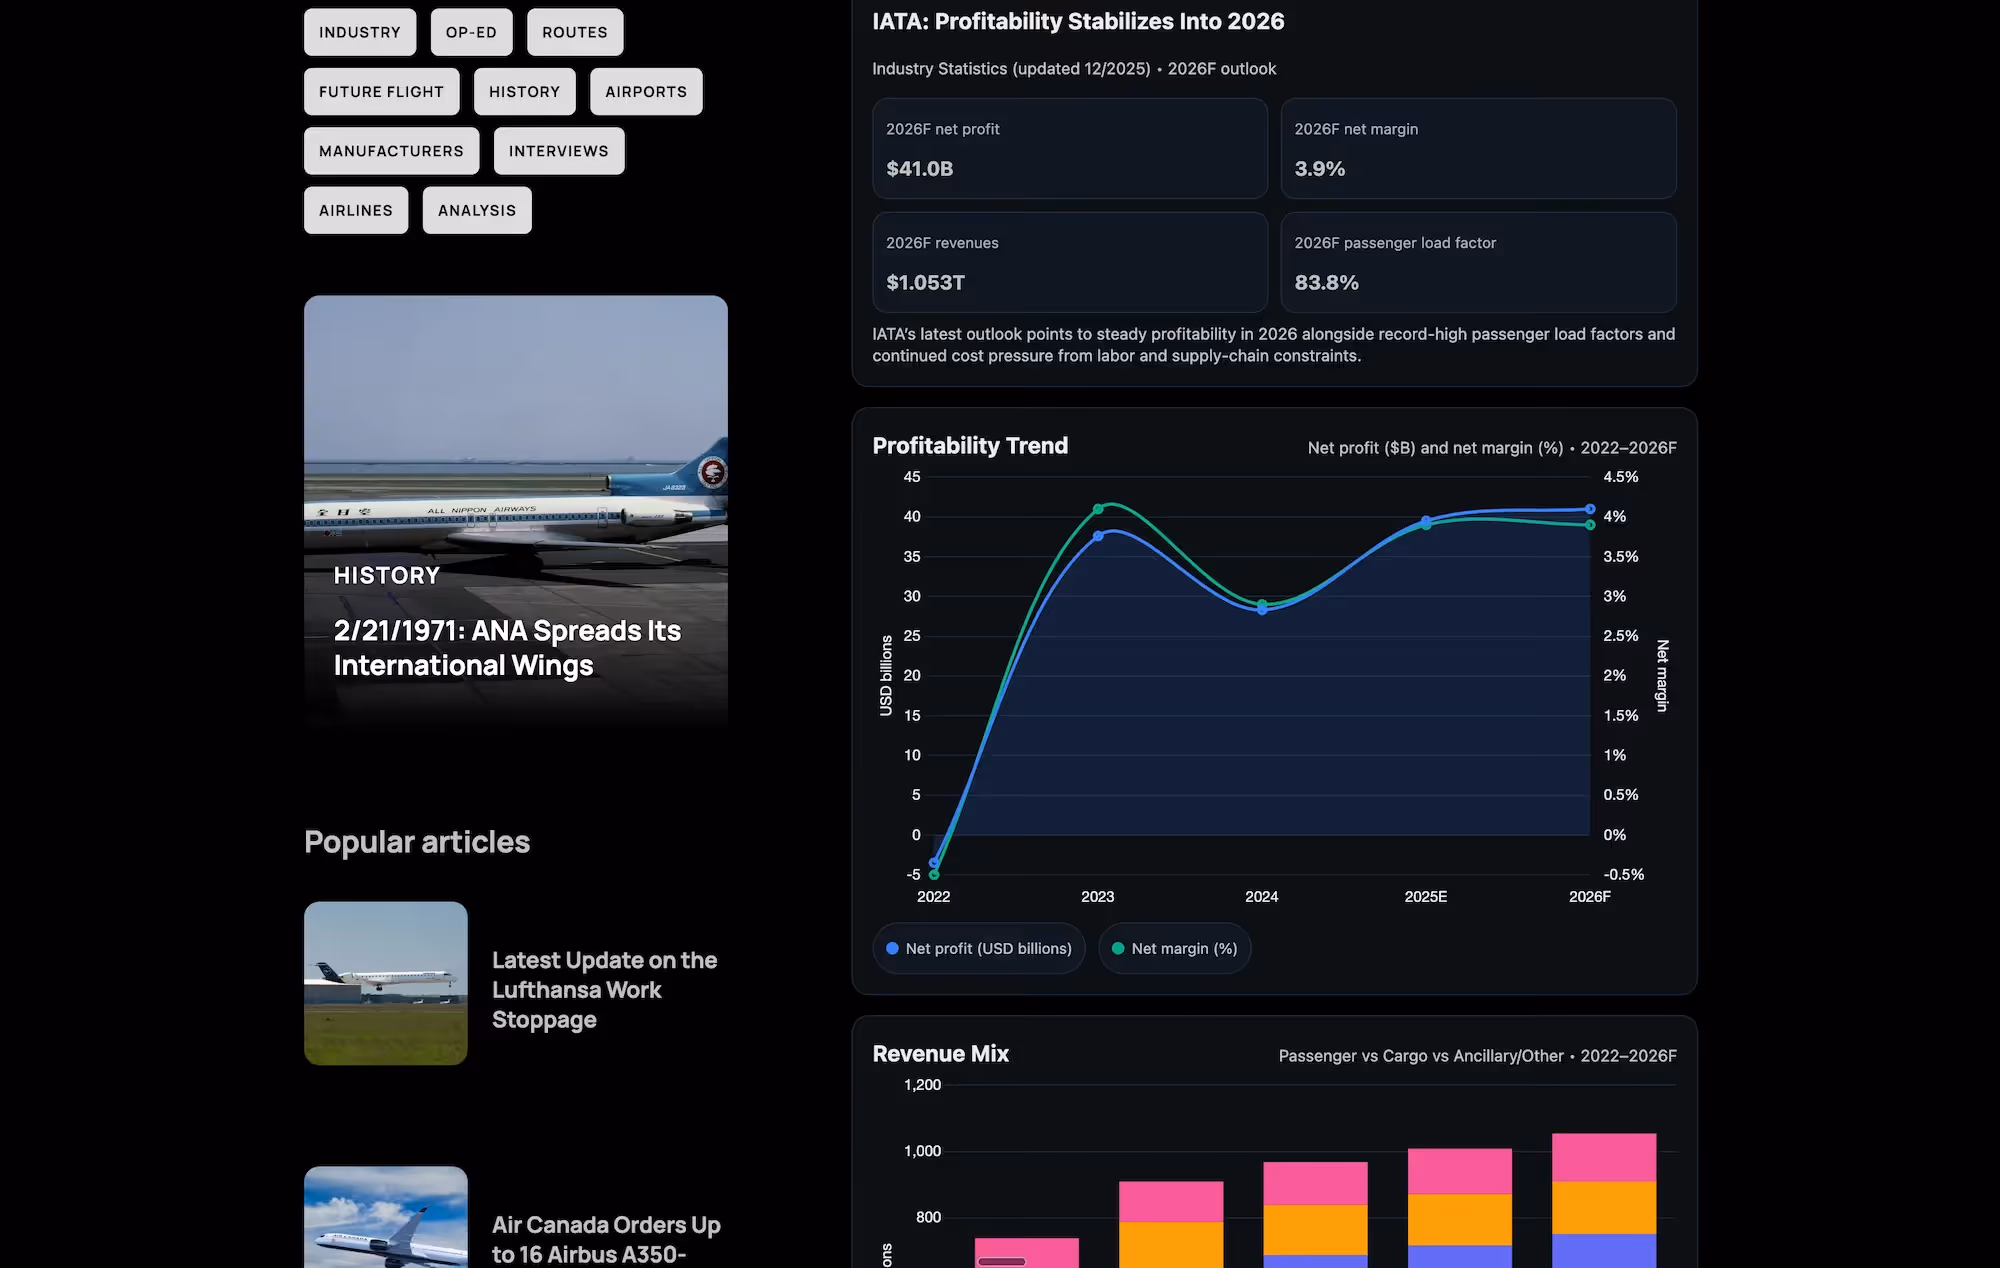
Global airline profitability is stabilizing, not surging, according to IATA’s latest industry outlook.
Boeing’s Q4 profit came from a major sale, while Commercial Airplanes still lost money despite 160 deliveries and backlog growth.
Cirium data show 5,425 Canadian-made aircraft fly in the U.S., including 2,678 Bombardier jets, amid a new decertification threat.
Airbus delivered 793 commercial aircraft in 2025, with single-aisle output again doing most of the volume lift.
OAG reports strong global air travel growth in 2025, with record seats, rising connectivity, and continued recovery momentum.
A global review of commercial flight


.avif)
.avif)
.avif)

.webp)
.webp)
.webp)